


Insights
SEO
Copy Link


Learn how Webflow A/B testing improves conversions—test CTAs, forms, and mobile layouts, use heatmaps when traffic is low, and measure with native tools.
A/B testing helps you make data-driven decisions by testing two versions of a webpage element (like a headline or button) to see which performs better. For Webflow users, this means faster updates without relying on developers. Tools like Webflow Optimize allow you to test, measure, and automatically direct traffic to the better-performing version, saving time and boosting results.
Key takeaways:
Webflow simplifies A/B testing with its visual interface, AI traffic routing, and SEO-safe features. Focus on high-impact areas like CTAs, forms, and mobile usability for the best results. However, A/B testing requires enough traffic and time to yield reliable data. For low-traffic sites, alternatives like heatmaps or surveys can provide insights.
Test consistently, track results, and refine your approach to drive steady growth.

A/B Testing Impact: Key Statistics and Conversion Rate Improvements
Businesses using A/B testing on Webflow have reported impressive boosts in conversion rates. For example, Retool's growth marketing team, led by Katie Giori, simplified their demo request forms by cutting out unnecessary fields that were creating friction. The result? A 70% jump in demo requests in 2025.
"With Webflow Optimize, we gained the autonomy to quickly design, launch, and measure experiments. The ease of setting up tests and collaborating across teams has elevated our entire web strategy." - Katie Giori
Another success story comes from Waste Connections, which focused on mobile-specific changes like shortening descriptions and repositioning CTAs. These targeted adjustments led to an 81% increase in conversions. By zeroing in on specific elements instead of overhauling their entire site, they achieved significant results.
Aspect's marketing team tested different CTA options and uncovered some surprising insights. Initially, "Contact Sales" performed better, but over time, "Get a Tour" emerged as the clear winner. These iterative experiments helped them double their website conversion rates within just a few months in 2025.
These examples highlight how even small, focused changes can lead to substantial improvements, a concept we'll explore further in the next section.
To optimize your site effectively, it’s essential to focus on elements that deliver the most impact. Key areas like above-the-fold components - headlines, hero images, and primary CTAs - can drive immediate results. Even minor tweaks, such as changing CTA language (e.g., "Get Demo" vs. "Start Free Trial"), have been shown to double conversion rates.
Form optimization is another area with significant potential, especially for lead generation. Reducing the number of fields in a form - from five to three, for instance - can eliminate barriers and increase completion rates. Webflow users have reported a 56% boost in form submissions by making such adjustments. Mobile-specific optimizations can amplify these results even further.
It’s also wise to prioritize high-impact pages like pricing pages, demo request forms, and product tours. Small, consistent gains on these pages can add up over time. For example, a 2% monthly improvement through continuous testing can lead to a roughly 26% increase over the course of a year.
While A/B testing can deliver great results, it’s not a perfect solution for every situation. One major limitation is that it requires sufficient traffic to generate reliable data. For websites with fewer than 1,000 weekly visitors, reaching statistical significance can be challenging. This can lead to prolonged tests and potentially misleading conclusions.
"Drawing incorrect conclusions from your data is dangerous, as you might make changes that make your website less effective." - Nikolai Bain
Another pitfall is ending tests too early, which can result in false positives. A general guideline is to let tests run until they reach at least 20% of your monthly traffic before making decisions. Additionally, external factors like seasonal trends or spikes from marketing campaigns can distort test results if not accounted for.
For websites with low traffic, alternative methods like heatmaps, session recordings, user surveys, and direct user testing can provide valuable insights without requiring a large volume of visitors. These qualitative approaches can help identify areas for improvement when A/B testing isn’t feasible.
The best A/B tests on Webflow don’t start with vague ideas - they begin with specific, measurable predictions. For example, instead of saying, "Let’s test the homepage", a more effective approach would be: "By changing the CTA button text from 'Learn More' to 'Get Started,' we expect click-through rates to increase by 15%." This kind of clear hypothesis takes the guesswork out of testing and sets a concrete goal to measure success.
Focus on testing one element at a time. Isolating changes helps you pinpoint what’s working and what’s not. Even if a test doesn’t confirm your hypothesis, it can still deliver valuable insights for future iterations.
"A/B testing turns guesswork into growth by helping Webflow users make data-backed design and content decisions." - Stefan Ivic
Before running any test, identify your Webflow SEO tips for lead generation and key performance indicators (KPIs)—whether it’s click-through rates, form submissions, or sign-ups - and gather baseline data. This ensures you have meaningful benchmarks to compare against.
For reliable results, you need enough traffic and sufficient test time. Websites with fewer than 1,000 weekly visitors aren’t ideal for A/B testing because they can’t achieve statistical significance. Aim to include at least 20% of your monthly traffic in each test before drawing conclusions.
Run your tests for at least two weeks to account for daily traffic fluctuations. Small sample sizes or short durations can lead to misleading outcomes. Ensuring your site follows a Webflow hosting performance guide can help maintain the speed necessary for accurate data collection. For instance, in 2024, Waste Connections used Webflow Optimize to test a button design and saw a 36% increase in conversions by following these best practices.
If your site has lower traffic, focus on pages with the highest potential impact - like pricing pages or demo request forms. You can also combine A/B testing with tools like heatmaps, session recordings, or user surveys to gather additional insights.
The most successful Webflow teams don’t stop after one test - they establish a consistent testing routine. Incremental gains, like a 2% monthly increase in conversions, can lead to a 26% improvement over a year. This steady, disciplined approach often delivers better results than chasing a single game-changing idea.
Set up a repeatable testing schedule. Perform daily quality checks during the first 24 hours of a test and review performance weekly. Aim to generate at least one new test idea every week. Webflow Optimize’s AI-driven traffic routing can also help by directing more visitors to winning variations early, minimizing the impact of underperforming designs.
Documenting your hypotheses and results is equally important. By keeping a record of what you’ve tested and learned, your team can build on past successes and avoid repeating mistakes. This approach ensures continuous improvement and sets the stage for efficient test execution, which is covered in the next section.
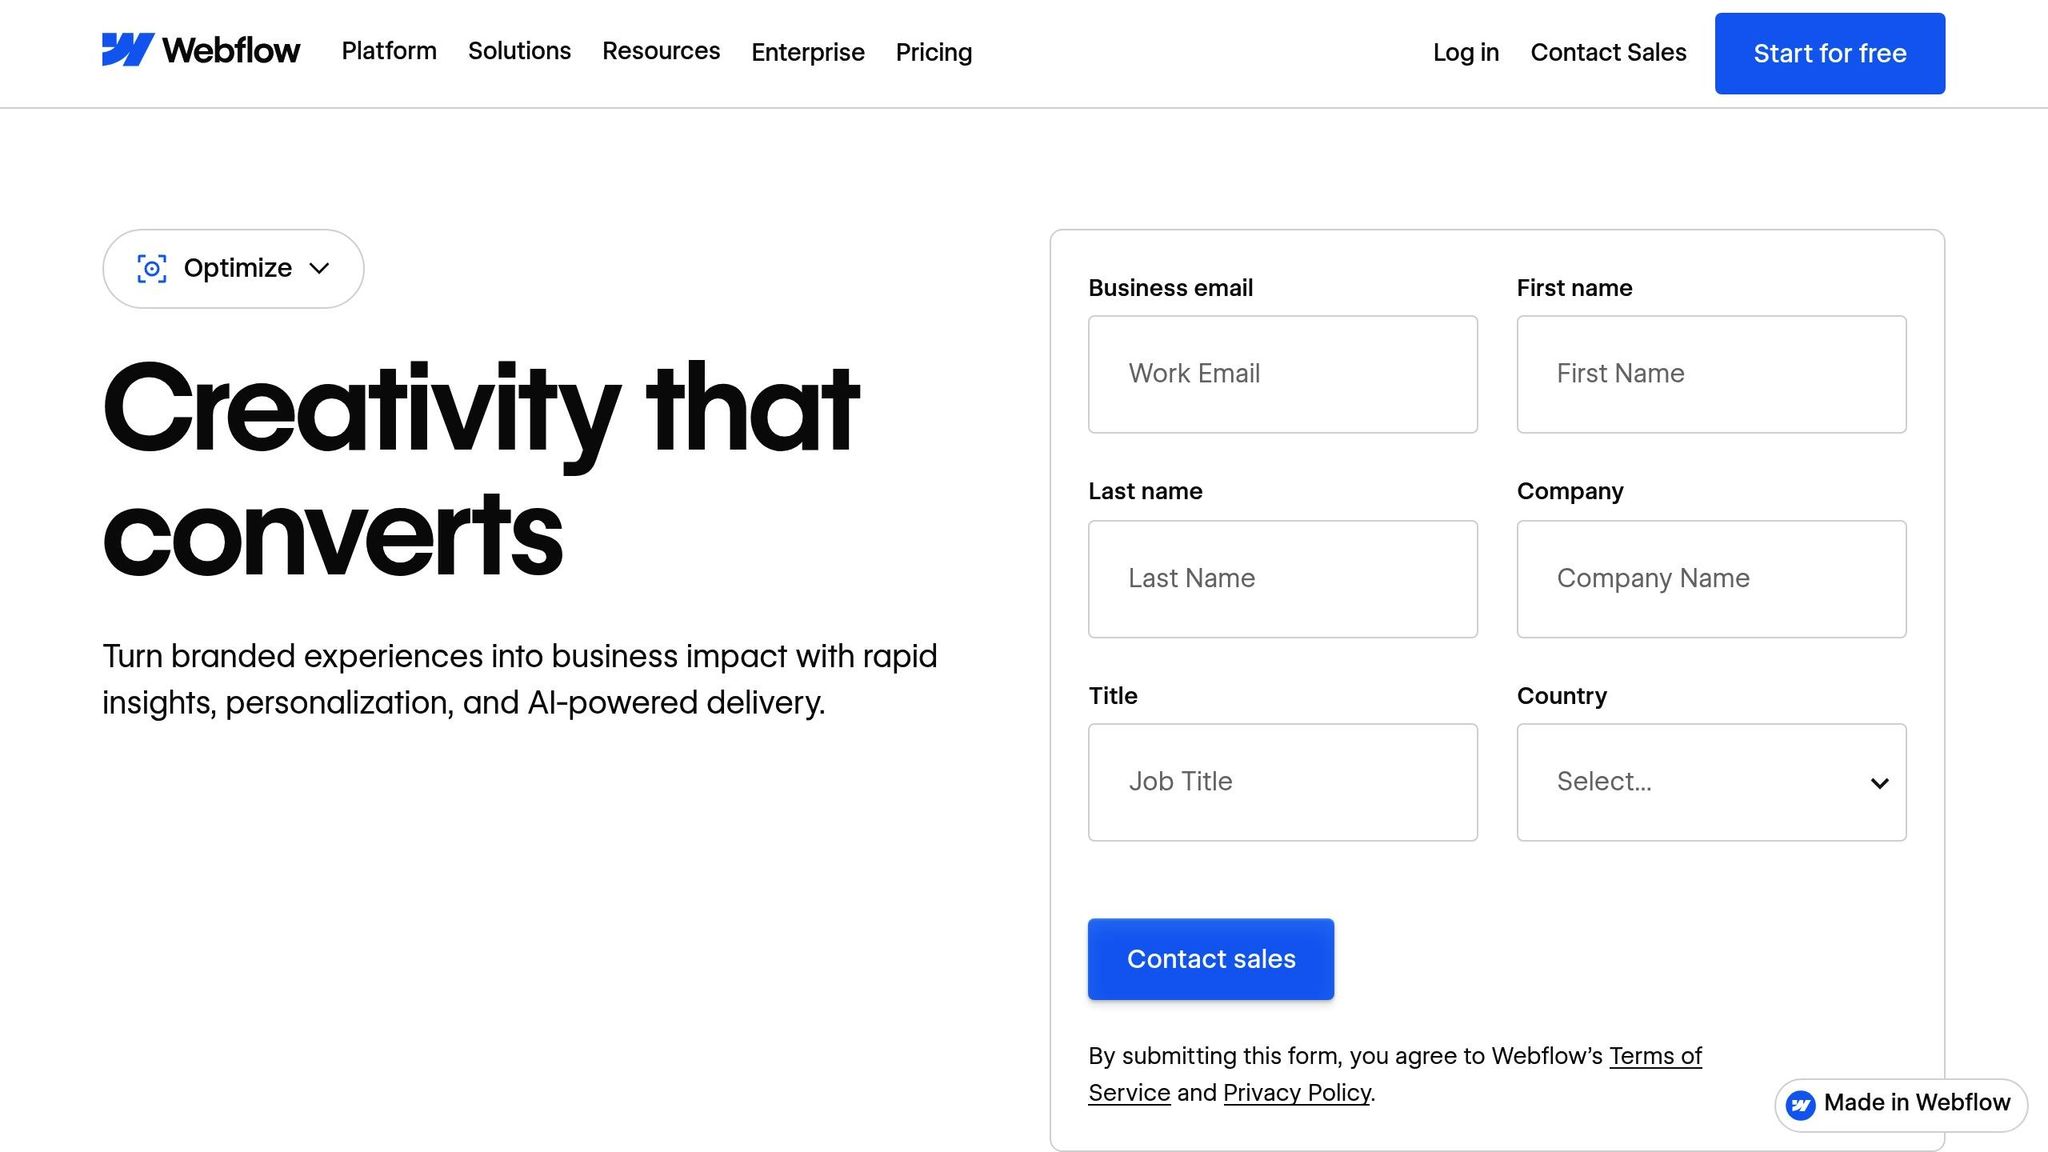
Webflow Optimize is Webflow's built-in A/B testing tool that integrates seamlessly into the Designer - no coding required. Starting at $299 per month, it offers two types of tests. The first is a traditional test with a fixed traffic split (e.g., 50/50) that concludes when statistical significance is achieved. The second is an AI-driven test that dynamically adjusts traffic to favor the better-performing variation in real time, adapting as visitor behavior evolves. This approach helps boost conversions while the test is still running. For added functionality, Webflow Optimize can connect with CRM platforms like Salesforce and HubSpot, enabling advanced personalization by leveraging firmographic data.
In 2024, Kokko Tso, Walker & Dunlop's VP of Digital Marketing, highlighted the benefits of this tool:
"Combined with Webflow's visual-first platform, Optimize and Analyze empower our teams to evolve with our clients, experiment and pivot quickly, and, ultimately, create more personalized digital experiences."
For those seeking a more affordable alternative, Optibase is available in the Webflow App Marketplace. Starting at $39 per month (or $32.50 with annual billing), it allows you to select elements directly in the Designer to set as variants or conversion goals. If your team requires advanced analytics, consider integrating third-party tools like VWO ($393/month) or Crazy Egg ($29/month) by adding their code snippets to your site's custom code settings. Once your testing variations are ready, the next step is to establish accurate tracking for user interactions and conversions.
After choosing your testing tool, implementing robust analytics is essential to measure the impact of your tests. Accurate conversion tracking ensures you can evaluate performance effectively. Webflow Analyze offers native audience insights within the Webflow platform, while Google Analytics 4 (free) can be integrated by adding your GA Tracking ID in the Project Integration Settings and enabling the Global site tag for event tracking.
Before starting, clearly define your conversion goals - such as button clicks, form submissions, or page views - to focus on specific variables. It's crucial to test only one element at a time in order to attribute performance changes accurately. Avoid altering a live variation or its tracking settings during an experiment, as this could introduce inconsistencies and skew your results. For split URL tests, use canonical meta tags to specify the original version for search engines, helping to avoid SEO penalties.
While analytics can reveal how your conversion rates are performing, tools like heatmaps and session recordings provide deeper insights into user behavior. By visualizing where visitors are clicking or scrolling, these tools can help you identify friction points. Consider integrating platforms like Hotjar, Crazy Egg, or VWO through code snippets to uncover high-impact areas, such as overlooked buttons or skipped sections.
Scrollmaps, for example, show where visitors lose interest, helping you reposition critical CTAs or headlines to more engaging areas of the page. Session recordings, on the other hand, are invaluable for spotting issues like "rage clicks", where users repeatedly click on non-interactive elements. These insights can guide your next test variation by highlighting opportunities to add interactive features or improve usability.
Combining visual data with quantitative metrics provides both the numbers and the story behind them. Interestingly, only about 12% of design changes lead to a measurable improvement, as seen in these landing page layout case studies, so using heatmaps to validate your hypotheses before running tests can save you a lot of time.
Let’s break down what marketing teams can realistically expect when it comes to conversion rate improvements. Even small, consistent gains can make a big difference. For example, achieving just a 2% lift every month adds up to about a 26% improvement over the course of a year. On the higher end, successful tests have been shown to increase conversions by 70%–81%, or even double them, as seen in the earlier case studies. These numbers highlight the importance of ongoing and thorough testing as a strategy for meaningful growth.
Consistency is the secret ingredient in optimizing your marketing strategy. To keep things running smoothly, start by conducting quality assurance (QA) checks within the first 24 hours of launching a test. This helps catch any layout or analytics issues early on. Then, make it a habit to review headline metrics and segment breakouts weekly, while also brainstorming at least one new test idea each week. Ideally, tests should run for 3–4 weeks or until they’ve reached 20% of your monthly traffic.
Focus your efforts on pages with the most potential - those with high traffic above the fold or pages tied directly to conversions, like pricing, demo requests, or checkout pages. With mobile traffic often accounting for 70% or more of site visits, running mobile-specific tests is critical. Also, to pinpoint what’s driving results, test one variable at a time, such as a headline, CTA button color, or form length. For goals that take place off-site or over an extended period, use on-site proxies like "Start Trial" clicks to get faster feedback. Following these practices ensures a steady path toward long-term optimization.
A successful A/B testing program requires more than just tools - it demands expertise and a commitment to constant improvement. That’s where The Hoop Studio steps in. Their Ongoing Web Partner service, starting at $1,000 per month, offers marketing teams dedicated support for page builds, conversion tweaks, and analytics reviews. This subscription-based service ensures you’re always equipped to implement winning variations, archive underperforming tests, and maintain momentum without overburdening your internal team.
The Hoop Studio helps you sidestep common mistakes, like ending tests too early or making too many changes at once, which can muddy your results. Their services include everything from Google Analytics and conversion tracking to CRM integrations and performance optimization. Acting as an extension of your team, they turn testing insights into actionable strategies that drive measurable revenue growth.
Webflow Optimize makes A/B testing a breeze by integrating it directly into the Webflow platform. No need for third-party tools or custom scripts - marketers can create different versions of pages or elements, set traffic distribution, and launch experiments all within Webflow. This setup not only saves time but also cuts down on unnecessary complexity.
The platform comes with built-in analytics that track key metrics like conversions, click-through rates, and engagement for each variation. These insights are clear and easy to act on. Plus, AI-powered features take it a step further by suggesting impactful changes, predicting potential outcomes, and even personalizing content for specific audience segments in real time. With Webflow Optimize, improving conversion rates through A/B testing is both simple and effective.
To boost conversion rates, it's important to experiment with key elements on your site, such as:
By testing these areas methodically, you'll gain valuable insights into what works best for your audience and can fine-tune your Webflow site for better results.
If your Webflow site isn’t getting much traffic, it’s better to focus on conversion rate optimization (CRO) rather than relying on A/B testing as a way to drive visitors. Start with a clear, measurable hypothesis - like testing whether changing a headline or button text increases clicks. Concentrate on high-impact elements, such as calls-to-action, headlines, or layouts, as these can still yield meaningful results even with fewer visitors.
Low traffic means tests will take longer to reach statistical significance, so plan for extended testing periods and keep a close eye on confidence levels. To make up for limited data, tools like heatmaps, session recordings, or user surveys can help you pinpoint areas where users might be running into issues that hurt conversions.
You can also boost your efforts with small-scale traffic-building strategies. For example, publish SEO-friendly blog posts or share your page with an existing email list. Need professional help? The Hoop Studio specializes in designing, running, and analyzing A/B tests while fine-tuning your Webflow site to improve conversions.