


Insights
Conversion
Copy Link


Start with pages closest to conversion: set one goal per page, map journeys, and remove messaging, CTA, form, speed, mobile and trust friction.
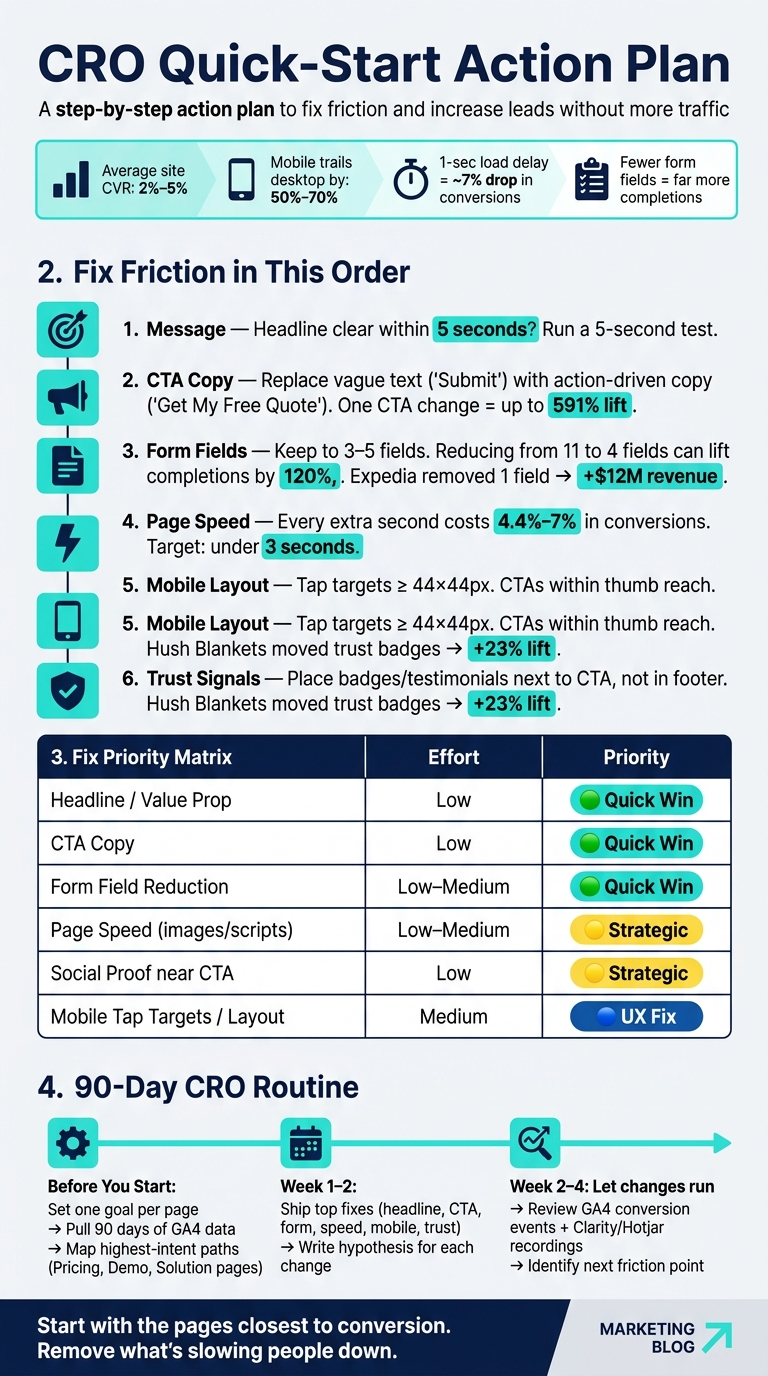
Want more leads without more traffic? Start with the pages closest to conversion. On most marketing sites, conversion rates sit around 2%–5%, mobile often trails desktop by 50%–70%, a 1-second load delay can cut conversions by about 7%, and shorter forms can drive far more completions.
Here’s the short version: I’d start by picking one main goal per page, setting a 90-day GA4 baseline, mapping the highest-intent user paths, and fixing the biggest points of friction first. In most cases, that means improving headlines, CTA copy, forms, page speed, mobile layout, and trust cues using proven ways to boost website conversion rates before running deeper tests.
If I had to boil the article down into a simple action plan, it would be this:
A few numbers from the article stand out:
So if you’re wondering where to start with CRO, the answer is simple: don’t start with fancy tests. Start with the pages and steps where people are already close to taking action, then remove what’s slowing them down.
CRO Quick-Start Action Plan: Fix Friction in the Right Order
Before you change a page, get clear on what that page is supposed to do. Give each important page one job: "This page should get visitors to [action]."
That sounds simple, but it keeps a site from drifting into mixed signals and weak calls to action.
Each key page should have one primary conversion action.
For a SaaS site, that usually means Book a Demo or Start Free Trial. For a service-led business, it's more often Request a Quote, Contact Sales, or Schedule a Consultation.
When one page tries to drive visitors toward three or four competing actions at the same time, performance usually slips. People hesitate, click around, or leave.
Alongside that main goal, track a small set of micro-conversions. These are smaller actions that show intent before someone takes the main step.
Common examples include:
These actions help you see where interest fades before the final conversion. In plain English, they show where people are leaning in, and where they drop off. That's often where the next fix lives.
If you use a secondary CTA, keep it low-commitment and tied to the same page goal.
Once your goals are set, record a GA4 baseline before you touch anything. Pull at least 90 days of data to smooth out short-term spikes or seasonal swings.
Then break the data down by page type, device, user type, and traffic source. This part matters more than many teams think. Mobile conversion rates are consistently 50% to 70% lower than desktop on most sites. If you lump mobile and desktop into one average, you can miss a major leak.
Use GA4 funnel exploration reports to map the path visitors take from arrival to conversion. Look closely at where they exit. Also, track form starts and form submits as separate steps. The gap between those two numbers often points straight to the next page or form issue to fix.
Put all of this into a simple spreadsheet. No need for anything fancy. You just want a clear before-and-after record, so you can spot which pages and paths need journey mapping first.
Most marketing sites have a lot of pages. But in practice, only a handful of paths tend to drive the enquiries, sign-ups, or demo bookings that matter most.
So the job isn't to tune every page at once. It's to find the journeys that bring in the highest-value traffic and fix the parts that are getting in the way first.
Start by setting up conversion goals to establish a baseline and spot which journeys deserve attention first. In GA4 Funnel Exploration, map the paths that lead to conversion. For example: Visit Pricing → Click Trial → Complete Form.
Then break that funnel down by traffic source and device type. Highest-intent paths often begin with organic search or a paid ad that closely matches the landing page offer. And mobile journeys can look very different from desktop ones.
Once you can see where users drop off at each step, the biggest leak in the funnel usually stands out fast. That's where to focus first.
Pay close attention to pages with high buying intent, such as:
These are the moments where consideration starts turning into commitment. Even small friction here can have an outsized effect on whether someone takes the next step.
Next, open session recordings on the highest-intent pages to see why users stop. GA4 shows you where people drop off. Session recordings and heatmaps show you why.
Both Hotjar and Microsoft Clarity let you watch real sessions filtered to specific pages. That matters because you don't need to sift through random recordings. Instead, focus on visitors who reached a high-intent page, like a pricing page or lead form, but didn't convert.
Look for a few clear signals. Rage clicks happen when a user clicks the same element again and again. That usually means something looks clickable but isn't. Dead clicks on images or icons that don't link anywhere can interrupt the journey. Scroll maps show whether key content, like testimonials, trust logos, or your main CTA, is even being seen.
GA4, recordings, and heatmaps help you see both what happens and why. Use those findings to rank the biggest friction points next.
Once you know where users drop off, fix the page in this order: message, CTA, form, speed, mobile, trust.
Start with the headline. A visitor should understand the offer within 5 seconds. A simple way to check: run a 5-second test. Show the page to someone who doesn't know your business, then ask what the offer is. If they struggle to explain it, the headline isn't doing its job.
Keep the value proposition, primary CTA, and one trust signal above the fold. That way, people can grasp the offer and take action without hunting around the page.
CTA wording also has more weight than many teams expect. Vague text like "Submit" tends to underperform compared with direct copy like "Get My Free Quote" or "Start My Free Trial". Small change, but it can move results.
Forms are one of the biggest conversion killers on marketing sites. Keep the first form short - ideally 3–5 fields - and push extra qualification to the next step. Expedia generated an additional $12 million in annual revenue by removing a single optional field from their booking flow.
Website speed optimisation is another fast place to look. Every extra second of load time costs about 4.4%–7% in conversions. Compress images, remove unused third-party scripts, and aim for a load time of under 3 seconds.
On mobile, make sure people can tap what matters without pinching, zooming, or misclicking. Tap targets should be at least 44×44 pixels, and key CTAs should sit within easy thumb reach.
After copy and form issues, look at trust. At the moment of decision, does the page give people a reason to feel comfortable moving forward?
Put trust signals next to the decision point, not buried in the footer. One testimonial, client logo, or security badge beside the primary CTA can do more than a long strip of logos at the bottom of the page. Hush Blankets saw a 23% conversion lift by moving trust badges next to the checkout button instead of leaving them in the footer.
Before you start making changes, rank the fixes by impact and effort:
| Fix | Implementation Effort | Priority |
|---|---|---|
| Headline / value proposition | Low (minutes) | 1 - Quick win |
| CTA copy | Low (minutes) | 1 - Quick win |
| Form field reduction | Low–Medium | 1 - Quick win |
| Page speed (images/scripts) | Low–Medium | 2 - Quick win |
| Social proof near CTA | Low (minutes) | 2 - Strategic |
| Mobile tap targets / layout | Medium | 3 - UX fix |
Once you've ranked your priorities, ship the smallest batch first. Begin with the top fixes on your highest-traffic pages: headline, CTA, form, speed, mobile, and trust. In most cases, you can get these changes live in a day or less.
Before you touch anything, write a simple hypothesis for each change using this formula: "If we [change], then [metric] will [improve] because [reason]." That gives each update a clear test instead of turning it into a guessing game. Then measure the same pages and actions you used when you set your baseline.
Let the changes run for two to four weeks before you judge the results. After that, review GA4 conversion events and Clarity recordings to see what changed and where people still get stuck.
In Webflow, reusable components and CMS-driven pages make these updates faster to ship and easier to QA. This is especially true when managing high-converting landing pages at scale.
CRO starts with goals, journeys, and friction - not cosmetic tweaks. Define the goal, map the journey, remove friction, and then test the fix. Start small, stay consistent, and let the data show you what to do next.
Use your data to spot where the biggest revenue leaks are.
Start with high-traffic pages that have low conversion rates. Then look for pages with high exit or bounce rates, and compare mobile vs. desktop performance. That often shows where things are breaking down.
After you choose a priority page, review session recordings and heatmaps in Hotjar or Microsoft Clarity. Watch for places where visitors pause, drop off during forms, or skip past your calls to action.
Before you change anything, make sure your tracking works the way it should.
Check that your GA4 conversion events - like form submissions, button clicks, and sign-ups - are firing correctly and marked as conversions. Also, filter out internal traffic so your data stays clean.
Next, set a baseline conversion rate for your main goals. That gives you a clear starting point, so you can tell if later changes are helping or just making noise.
You should also use Microsoft Clarity or Hotjar for heatmaps and session recordings. Those tools help you spot where visitors drop off, where they hesitate, and what might be getting in their way.
It depends on how much traffic your site gets. With 10,000 monthly visitors, an A/B test can hit significance in about a week. With 2,000 monthly visitors, that same test might take four to six months. By then, the result may not matter as much.
For most small to mid-sized businesses, a simpler approach often works better: use high-confidence best practices, then compare performance before and after the changes. Just make sure you set a baseline first.